
Texas Rangers at Los Angeles Angels
· Major League Baseball
Texas Rangers
13-14, 5-9 Away
Final
3 - 3
3 - 3

Los Angeles Angels
10-15, 7-6 HomeHow To Watch
How can I watch Texas Rangers vs. Los Angeles Angels?
- TV Channel: Rangers at Angels 2022 MLB Baseball, is broadcasted on FanDuel SN West.
- Online streaming: Sign up for Fubo.
Scoring Summary
 |
9th Inning | Robinson flied out to center. |
|
9th Inning | J. Lugo singled to right, De Jesus scored and Ketchup scored. |
|
9th Inning | Scull struck out swinging. |
|
9th Inning | Ketchup ran for Blankenhorn |
|
9th Inning | Blankenhorn singled to center, De Jesus to second. |
|
9th Inning | De Jesus bunted into fielder's choice to pitcher, Nicholson out at second. |
Statistics
 TEX TEX |
 LAA LAA |
|
|---|---|---|
| 1 | Games Played | 1 |
| 1 | Team Games Played | 1 |
| 0 | Hit By Pitch | 0 |
| 0 | Ground Balls | 0 |
| 10 | Strikeouts | 8 |
| 3 | Runs Batted In | 3 |
| 0 | Sacrifice Hit | 0 |
| 9 | Hits | 7 |
| 0 | Stolen Bases | 0 |
| 2 | Walks | 1 |
| 0 | Catcher Interference | 0 |
| 3 | Runs | 3 |
| 0 | Ground Into Double Play | 1 |
| 0 | Sacrifice Flies | 1 |
| 35 | At Bats | 32 |
| 0 | Home Runs | 0 |
| 0 | Grand Slam Home Runs | 0 |
| 14 | Runners Left On Base | 12 |
| 0 | Triples | 0 |
| 0 | Game Winning RBIs | 0 |
| 0 | Intentional Walks | 0 |
| 1 | Doubles | 1 |
| 0 | Fly Balls | 0 |
| 1 | Caught Stealing | 0 |
| 0 | Pitches | 0 |
| 0 | Games Started | 0 |
| 0 | Pinch At Bats | 0 |
| 0 | Pinch Hits | 0 |
| 0.0 | Player Rating | 0.0 |
| 1 | Is Qualified | 1 |
| 1 | Is Qualified In Steals | 0 |
| 10 | Total Bases | 8 |
| 37 | Plate Appearances | 34 |
| 0.0 | Projected Home Runs | 0.0 |
| 1 | Extra Base Hits | 1 |
| 2.7 | Runs Created | 1.4 |
| .257 | Batting Average | .219 |
| .000 | Pinch Hit Average | .000 |
| .286 | Slugging Percentage | .250 |
| .057 | Secondary Average | .063 |
| .297 | On Base Percentage | .235 |
| .583 | OBP Pct + SLG Pct | .485 |
| 0.0 | Ground To Fly Ball Ratio | 0.0 |
| 2.7 | Runs Created Per 27 Outs | 1.4 |
| 23.0 | Batter Rating | 21.0 |
| 0.0 | At Bats Per Home Run | 0.0 |
| 0.00 | Stolen Base Percentage | 0.00 |
| 0.00 | Pitches Per Plate Appearance | 0.00 |
| .029 | Isolated Power | .031 |
| 0.20 | Walk To Strikeout Ratio | 0.13 |
| .054 | Walks Per Plate Appearance | .029 |
| -.200 | Secondary Average Minus Batting Average | -.156 |
| 6.0 | Runs Produced | 6.0 |
| 1.0 | Runs Ratio | 1.0 |
| 0.3 | Patience Ratio | 0.3 |
| 0.4 | Balls In Play Average | 0.3 |
| 75.3 | MLB Rating | 72.3 |
| 0.0 | Offensive Wins Above Replacement | 0.0 |
| 0.0 | Wins Above Replacement | 0.0 |
Game Information
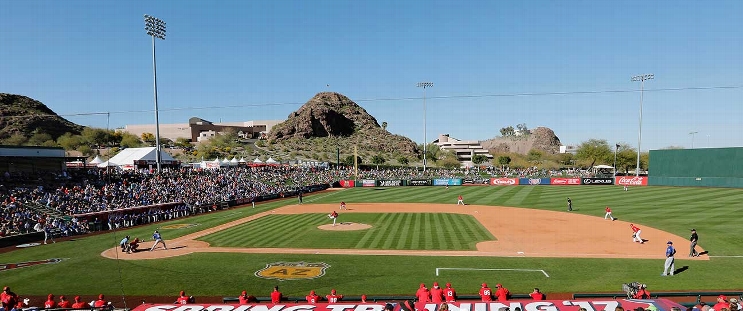
Tempe Diablo Stadium
Location: Tempe, Arizona
Attendance: 6,334 | Capacity:
2025 American League West Standings
| TEAM | W | L | PCT | GB | STRK |
|---|---|---|---|---|---|
| Los Angeles |
- | 5 | W1 | 0.64285713 | 9 |
| Texas |
0.5 | 6 | L2 | 0.6 | 9 |
 Seattle Seattle |
2.5 | 8 | W3 | 0.46666667 | 7 |
 Houston Houston |
3 | 8 | L1 | 0.42857143 | 6 |
 Athletics Athletics |
3.5 | 9 | W1 | 0.4 | 6 |