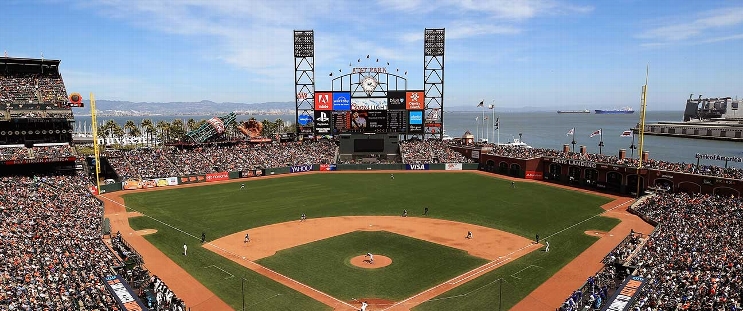
Arizona Diamondbacks at San Francisco Giants
· Major League Baseball
2 - 1

Corbin Carroll homers twice off Justin Verlander and the Diamondbacks beat the Giants 2-1

Carroll hit a 2-1 pitch from Verlander over the wall in left-center in the third. He went deep again — a 419-foot shot to center, his 13th of the season — on a 1-1 pitch leading off the fifth for a 2-0 lead.
The Giants got their lone run in the bottom half off Diamondbacks starter Merrill Kelly. Willy Adames led off with a double and scored on a two-out single to right by Christian Koss, who was thrown out by Carroll trying for a double.
Verlander (0-3) was pulled after allowing a leadoff single to Geraldo Perdomo in the seventh. He gave up nine hits.
Kelly (4-2) threw 103 pitches to get through seven innings. He gave up one run on eight hits with eight strikeouts. He's allowed two runs or fewer in seven of nine starts. Jalen Beeks pitched a scoreless eighth and Shelby Miller worked the ninth for his second save.
Carroll is one homer behind the Phillies’ Kyle Schwarber and the Yankees’ Aaron Judge for the major league lead.
San Francisco has lost four straight. The Giants were swept in three games at Minnesota before beginning this nine-game homestand.
Verlander also leads active players with 262 wins. He needs three to pass Gus Weyhing (1887-1901) for 40th in major league history.
How can I watch Arizona Diamondbacks vs. San Francisco Giants?
- TV Channel: Diamondbacks at Giants 2022 MLB Baseball, is broadcasted on FS1.
- Online streaming: Sign up for Fubo.
Scoring Summary
 |
9th Inning | Bailey struck out swinging. |
 |
9th Inning | Adames flied out to right. |
 |
9th Inning | Flores grounded out to shortstop. |
 |
9th Inning | Miller relieved Beeks |
 |
9th Inning | Thomas struck out looking. |
 |
9th Inning | Gurriel Jr. struck out swinging. |
Statistics
 ARI ARI |
 SF SF |
|
|---|---|---|
| 1 | Games Played | 1 |
| 1 | Team Games Played | 1 |
| 0 | Hit By Pitch | 0 |
| 11 | Ground Balls | 12 |
| 8 | Strikeouts | 10 |
| 2 | Runs Batted In | 1 |
| 0 | Sacrifice Hit | 0 |
| 9 | Hits | 8 |
| 0 | Stolen Bases | 0 |
| 1 | Walks | 1 |
| 0 | Catcher Interference | 0 |
| 2 | Runs | 1 |
| 1 | Ground Into Double Play | 1 |
| 0 | Sacrifice Flies | 0 |
| 34 | At Bats | 33 |
| 2 | Home Runs | 0 |
| 0 | Grand Slam Home Runs | 0 |
| 12 | Runners Left On Base | 14 |
| 0 | Triples | 0 |
| 1 | Game Winning RBIs | 0 |
| 0 | Intentional Walks | 0 |
| 3 | Doubles | 1 |
| 15 | Fly Balls | 11 |
| 1 | Caught Stealing | 0 |
| 103 | Pitches | 135 |
| 0 | Games Started | 0 |
| 0 | Pinch At Bats | 0 |
| 0 | Pinch Hits | 0 |
| 0.0 | Player Rating | 0.0 |
| 1 | Is Qualified | 1 |
| 1 | Is Qualified In Steals | 0 |
| 18 | Total Bases | 9 |
| 35 | Plate Appearances | 34 |
| 324.0 | Projected Home Runs | 0.0 |
| 5 | Extra Base Hits | 1 |
| 4.4 | Runs Created | 1.9 |
| .265 | Batting Average | .242 |
| .000 | Pinch Hit Average | .000 |
| .529 | Slugging Percentage | .273 |
| .265 | Secondary Average | .061 |
| .286 | On Base Percentage | .265 |
| .815 | OBP Pct + SLG Pct | .537 |
| 0.7 | Ground To Fly Ball Ratio | 1.1 |
| 4.4 | Runs Created Per 27 Outs | 2.0 |
| 29.0 | Batter Rating | 14.0 |
| 17.0 | At Bats Per Home Run | 0.0 |
| 0.00 | Stolen Base Percentage | 0.00 |
| 2.94 | Pitches Per Plate Appearance | 3.97 |
| .265 | Isolated Power | .030 |
| 0.13 | Walk To Strikeout Ratio | 0.10 |
| .029 | Walks Per Plate Appearance | .029 |
| .000 | Secondary Average Minus Batting Average | -.182 |
| 4.0 | Runs Produced | 2.0 |
| 1.0 | Runs Ratio | 1.0 |
| 0.6 | Patience Ratio | 0.3 |
| 0.3 | Balls In Play Average | 0.3 |
| 81.8 | MLB Rating | 69.5 |
| 0.0 | Offensive Wins Above Replacement | 0.0 |
| 0.0 | Wins Above Replacement | 0.0 |
Game Information

Location: San Francisco, California
Attendance: 27,387 | Capacity:
2025 National League West Standings
| TEAM | W | L | PCT | GB | STRK |
|---|---|---|---|---|---|
 Los Angeles Los Angeles |
- | 15 | W1 | 0.6511628 | 28 |
 San Diego San Diego |
0.5 | 15 | W2 | 0.64285713 | 27 |
 San Francisco San Francisco |
3.5 | 19 | L1 | 0.5681818 | 25 |
 Arizona Arizona |
5.5 | 21 | W1 | 0.52272725 | 23 |
 Colorado Colorado |
21 | 36 | L3 | 0.1627907 | 7 |