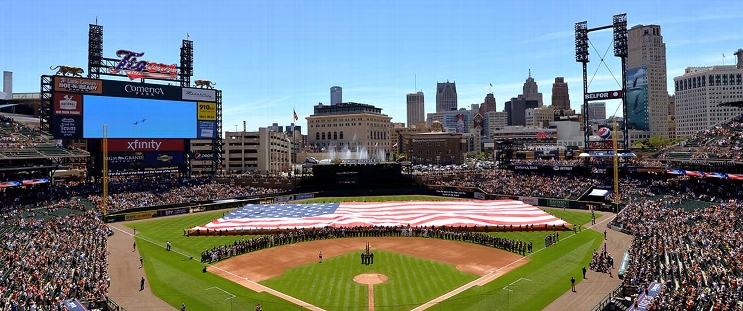
Boston Red Sox at Detroit Tigers
· Major League Baseball
2 - 14

Gleyber Torres homers and drives in 3 runs as Tigers rout Red Sox 14-2

Trey Sweeney also homered and leadoff hitter Kerry Carpenter scored three times in the first three innings for the Tigers, who improved to an AL-best 27-15.
Jackson Jobe (3-0) gave up one run in 5 2/3 innings. He allowed three hits, struck out seven and walked five.
Wilyer Abreu and Abraham Toro homered for Boston.
Tanner Houck (0-3) allowed 11 runs in 2 1/3 innings. It's the second time he has given up 11 earned runs in a start this year, making him the first Red Sox pitcher to do it.
The Tigers took an early lead on Torres' two-run homer in the first inning.
Detroit then scored nine runs in the third. Riley Greene hit a two-run single scored when it skipped past Abreu in right field and rolled to the wall. Sweeney added a three-run homer later in the inning.
Houck faced 11 batters in the inning and got just one out before being replaced by Sean Newcomb.
—
How can I watch Boston Red Sox vs. Detroit Tigers?
- TV Channel: Red Sox at Tigers 2022 MLB Baseball, is broadcasted on MLB.TV.
- Online streaming: Sign up for Fubo.
Scoring Summary
 |
9th Inning | Narváez flied out to right. |
 |
9th Inning | Hamilton reached on infield single to shortstop. |
 |
9th Inning | Rafaela flied out to center. |
 |
9th Inning | Wong popped out to shortstop. |
 |
9th Inning | Toro homered to right (356 feet). |
 |
9th Inning | Malloy in right field. |
Statistics
 BOS BOS |
 DET DET |
|
|---|---|---|
| 1 | Games Played | 1 |
| 1 | Team Games Played | 1 |
| 1 | Hit By Pitch | 1 |
| 11 | Ground Balls | 18 |
| 9 | Strikeouts | 4 |
| 2 | Runs Batted In | 11 |
| 0 | Sacrifice Hit | 0 |
| 6 | Hits | 18 |
| 0 | Stolen Bases | 0 |
| 5 | Walks | 3 |
| 0 | Catcher Interference | 0 |
| 2 | Runs | 14 |
| 1 | Ground Into Double Play | 0 |
| 0 | Sacrifice Flies | 0 |
| 32 | At Bats | 43 |
| 2 | Home Runs | 2 |
| 0 | Grand Slam Home Runs | 0 |
| 16 | Runners Left On Base | 21 |
| 0 | Triples | 0 |
| 0 | Game Winning RBIs | 1 |
| 0 | Intentional Walks | 0 |
| 0 | Doubles | 2 |
| 12 | Fly Balls | 21 |
| 0 | Caught Stealing | 0 |
| 140 | Pitches | 167 |
| 0 | Games Started | 0 |
| 1 | Pinch At Bats | 1 |
| 0 | Pinch Hits | 1 |
| 0.0 | Player Rating | 0.0 |
| 1 | Is Qualified | 1 |
| 0 | Is Qualified In Steals | 0 |
| 12 | Total Bases | 26 |
| 38 | Plate Appearances | 47 |
| 324.0 | Projected Home Runs | 324.0 |
| 2 | Extra Base Hits | 4 |
| 3.8 | Runs Created | 11.2 |
| .188 | Batting Average | .419 |
| .000 | Pinch Hit Average | 1.000 |
| .375 | Slugging Percentage | .605 |
| .344 | Secondary Average | .256 |
| .316 | On Base Percentage | .468 |
| .691 | OBP Pct + SLG Pct | 1.073 |
| 0.9 | Ground To Fly Ball Ratio | 0.9 |
| 3.8 | Runs Created Per 27 Outs | 12.1 |
| 20.0 | Batter Rating | 78.0 |
| 16.0 | At Bats Per Home Run | 21.5 |
| 0.00 | Stolen Base Percentage | 0.00 |
| 3.68 | Pitches Per Plate Appearance | 3.55 |
| .188 | Isolated Power | .186 |
| 0.56 | Walk To Strikeout Ratio | 0.75 |
| .132 | Walks Per Plate Appearance | .064 |
| .156 | Secondary Average Minus Batting Average | -.163 |
| 4.0 | Runs Produced | 25.0 |
| 1.0 | Runs Ratio | 0.8 |
| 0.5 | Patience Ratio | 0.7 |
| 0.2 | Balls In Play Average | 0.4 |
| 73.8 | MLB Rating | 121.8 |
| 0.0 | Offensive Wins Above Replacement | 0.0 |
| 0.0 | Wins Above Replacement | 0.0 |
Game Information

Location: Detroit, Michigan
Attendance: 20,136 | Capacity:
2025 American League East Standings
| TEAM | W | L | PCT | GB | STRK |
|---|---|---|---|---|---|
 New York New York |
- | 18 | W1 | 0.5813953 | 25 |
 Boston Boston |
4 | 23 | L3 | 0.4888889 | 22 |
 Toronto Toronto |
4 | 22 | L1 | 0.4883721 | 21 |
 Tampa Bay Tampa Bay |
5 | 23 | W1 | 0.4651163 | 20 |
 Baltimore Baltimore |
9.5 | 27 | L3 | 0.35714287 | 15 |
2025 American League Central Standings
| TEAM | W | L | PCT | GB | STRK |
|---|---|---|---|---|---|
 Detroit Detroit |
- | 15 | W3 | 0.65909094 | 29 |
 Cleveland Cleveland |
3.5 | 18 | L1 | 0.5813953 | 25 |
 Kansas City Kansas City |
4.5 | 20 | L2 | 0.5555556 | 25 |
 Minnesota Minnesota |
5 | 20 | W11 | 0.54545456 | 24 |
 Chicago Chicago |
15 | 30 | L1 | 0.3181818 | 14 |