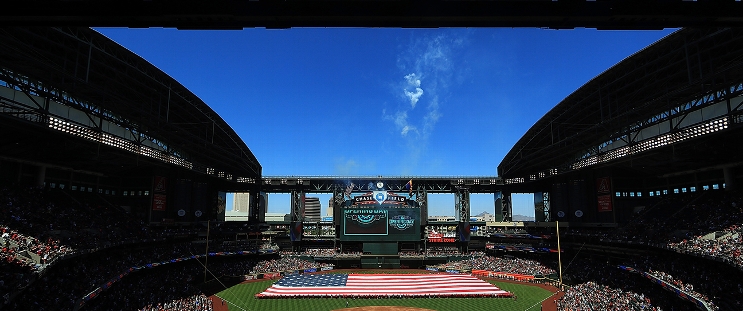
Los Angeles Dodgers at Arizona Diamondbacks
· Major League Baseball
8 - 1

Tony Gonsolin, Freddie Freeman lead Dodgers past Diamondbacks 8-1

Mookie Betts also went deep for the Dodgers, who had 18 hits and salvaged a four-game split with their National League West rivals. With San Diego’s 9-3 loss at Colorado, Los Angeles regained the division lead by one game over the Padres.
Gonsolin (2-0), making his third start after missing all of 2024 following Tommy John surgery, threw 84 pitches, walking two and striking out four. The right-hander lowered his ERA to 2.81, giving a boost to a Dodgers staff missing injured starters Blake Snell and Tyler Glasnow.
Freeman raised his NL-leading batting average to .376. He doubled in Mookie Betts in the first off Zac Gallen (3-5), doubled again in the third and hit a sacrifice fly in the fifth. He added his ninth homer, off Joe Mantiply, in the seventh, and singled against José Castillo in the ninth.
Betts' homer, his sixth, came off Castillo in the ninth.
Gallen lasted 5 1/3 innings, giving up 10 hits and four runs. He walked two and struck out five.
Arizona's José Herrera doubled off Ben Casparius in the seventh, scoring Alec Thomas from first.
How can I watch Los Angeles Dodgers vs. Arizona Diamondbacks?
- TV Channel: Dodgers at Diamondbacks 2022 MLB Baseball, is broadcasted on MLB.TV.
- Online streaming: Sign up for Fubo.
Scoring Summary
 |
9th Inning | Thomas lined out to center. |
 |
9th Inning | Gurriel Jr. flied out to right. |
 |
9th Inning | Suárez grounded out to third. |
 |
9th Inning | Sauer relieved Scott |
 |
9th Inning | Rojas flied out to right. |
 |
9th Inning | E. Hernández singled to center, Pages to second. |
Statistics
 LAD LAD |
 ARI ARI |
|
|---|---|---|
| 1 | Games Played | 1 |
| 1 | Team Games Played | 1 |
| 0 | Hit By Pitch | 0 |
| 18 | Ground Balls | 13 |
| 7 | Strikeouts | 7 |
| 8 | Runs Batted In | 1 |
| 0 | Sacrifice Hit | 0 |
| 18 | Hits | 6 |
| 1 | Stolen Bases | 0 |
| 2 | Walks | 2 |
| 0 | Catcher Interference | 0 |
| 8 | Runs | 1 |
| 0 | Ground Into Double Play | 0 |
| 1 | Sacrifice Flies | 0 |
| 41 | At Bats | 32 |
| 2 | Home Runs | 0 |
| 0 | Grand Slam Home Runs | 0 |
| 15 | Runners Left On Base | 7 |
| 0 | Triples | 0 |
| 1 | Game Winning RBIs | 0 |
| 0 | Intentional Walks | 0 |
| 4 | Doubles | 2 |
| 17 | Fly Balls | 12 |
| 2 | Caught Stealing | 1 |
| 144 | Pitches | 139 |
| 0 | Games Started | 0 |
| 3 | Pinch At Bats | 1 |
| 1 | Pinch Hits | 0 |
| 0.0 | Player Rating | 0.0 |
| 1 | Is Qualified | 1 |
| 1 | Is Qualified In Steals | 1 |
| 28 | Total Bases | 8 |
| 44 | Plate Appearances | 34 |
| 324.0 | Projected Home Runs | 0.0 |
| 6 | Extra Base Hits | 2 |
| 10.8 | Runs Created | 1.3 |
| .439 | Batting Average | .188 |
| .333 | Pinch Hit Average | .000 |
| .683 | Slugging Percentage | .250 |
| .268 | Secondary Average | .094 |
| .455 | On Base Percentage | .235 |
| 1.137 | OBP Pct + SLG Pct | .485 |
| 1.1 | Ground To Fly Ball Ratio | 1.1 |
| 11.2 | Runs Created Per 27 Outs | 1.3 |
| 65.0 | Batter Rating | 14.0 |
| 20.5 | At Bats Per Home Run | 0.0 |
| 0.33 | Stolen Base Percentage | 0.00 |
| 3.27 | Pitches Per Plate Appearance | 4.09 |
| .244 | Isolated Power | .063 |
| 0.29 | Walk To Strikeout Ratio | 0.29 |
| .045 | Walks Per Plate Appearance | .059 |
| -.171 | Secondary Average Minus Batting Average | -.094 |
| 16.0 | Runs Produced | 2.0 |
| 1.0 | Runs Ratio | 1.0 |
| 0.7 | Patience Ratio | 0.3 |
| 0.5 | Balls In Play Average | 0.2 |
| 114.0 | MLB Rating | 67.0 |
| 0.0 | Offensive Wins Above Replacement | 0.0 |
| 0.0 | Wins Above Replacement | 0.0 |
Game Information

Location: Phoenix, Arizona
Attendance: 46,292 | Capacity:
2025 National League West Standings
| TEAM | W | L | PCT | GB | STRK |
|---|---|---|---|---|---|
 Los Angeles Los Angeles |
- | 15 | W1 | 0.6511628 | 28 |
 San Diego San Diego |
0.5 | 15 | W2 | 0.64285713 | 27 |
 San Francisco San Francisco |
3.5 | 19 | L1 | 0.5681818 | 25 |
 Arizona Arizona |
5.5 | 21 | W1 | 0.52272725 | 23 |
 Colorado Colorado |
21 | 36 | L3 | 0.1627907 | 7 |