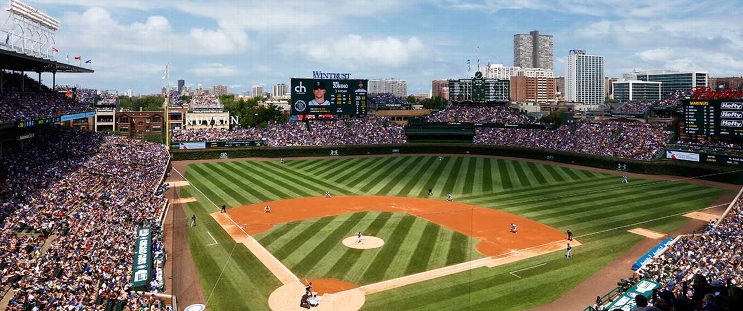
Arizona Diamondbacks at Chicago Cubs
· Major League Baseball
11 - 13

Kelly homers twice, Tucker hits go ahead shot as Cubs outslug Diamondbacks 13-11

Ian Happ hit a grand slam. Seiya Suzuki went deep and the Cubs pulled out a wild win after Arizona scored 10 runs in the eighth.
Chicago was sailing along with a 7-1 lead thanks to Kelly’s two-run drive against Diamondbacks starter Corbin Burnes in the second and Happ’s grand slam off Ryne Nelson in a five-run seventh. But just when it looked as if the Cubs were on their way to a lopsided win, things took a wild turn.
Eugenio Suárez cut it to 7-5 in the eighth with a grand slam against Porter Hodge. Randal Grichuk gave Arizona an 8-7 lead when his chopper scooted under third baseman Gage Workman’s glove for a two-run double. Lourdes Gurriel Jr. added a three-run drive, making it 11-7, but the Cubs answered in a big way in the bottom half.
Bryce Jarvis hit Nico Hoerner leading off and walked Pete Crow-Armstrong before Kelly drove a three-run homer to center. After Happ singled with one out, Tucker and Suzuki hit back-to-back drives against Joe Mantiply to give the Cubs a 13-11 lead.
Ryan Pressly (2-1) recorded the final three outs, and the Cubs opened the weekend series on a winning note. Arizona had won five straight.
Chicago’s Colin Rea went a season-high 4 2/3 innings, allowing one run and five hits. The 34-year-year-old right-hander struck out five and walked none in his second start and fifth appearance. The Cubs moved him to the rotation following ace Justin Steele’s season-ending elbow injury.
Burnes allowed two runs and six hits over six innings. The 2021 NL Cy Young Award winner struck out three and did not walk a batter.
How can I watch Arizona Diamondbacks vs. Chicago Cubs?
- TV Channel: Diamondbacks at Cubs 2022 MLB Baseball, is broadcasted on MLBN.
- Online streaming: Sign up for Fubo.
Scoring Summary
 |
9th Inning | Carroll flied out to shortstop. |
 |
9th Inning | Thomas doubled to right. |
 |
9th Inning | McCarthy grounded out to first. |
 |
9th Inning | Moreno fouled out to first. |
 |
9th Inning | Pressly relieved Roberts |
 |
9th Inning | Berti at third base. |
Statistics
 ARI ARI |
 CHC CHC |
|
|---|---|---|
| 1 | Games Played | 1 |
| 1 | Team Games Played | 1 |
| 0 | Hit By Pitch | 1 |
| 15 | Ground Balls | 14 |
| 9 | Strikeouts | 8 |
| 11 | Runs Batted In | 13 |
| 0 | Sacrifice Hit | 0 |
| 15 | Hits | 18 |
| 0 | Stolen Bases | 0 |
| 3 | Walks | 2 |
| 0 | Catcher Interference | 0 |
| 11 | Runs | 13 |
| 0 | Ground Into Double Play | 1 |
| 0 | Sacrifice Flies | 0 |
| 43 | At Bats | 41 |
| 2 | Home Runs | 5 |
| 1 | Grand Slam Home Runs | 1 |
| 14 | Runners Left On Base | 19 |
| 0 | Triples | 1 |
| 0 | Game Winning RBIs | 1 |
| 0 | Intentional Walks | 0 |
| 4 | Doubles | 3 |
| 19 | Fly Balls | 19 |
| 0 | Caught Stealing | 0 |
| 158 | Pitches | 176 |
| 0 | Games Started | 0 |
| 2 | Pinch At Bats | 1 |
| 2 | Pinch Hits | 0 |
| 0.0 | Player Rating | 0.0 |
| 1 | Is Qualified | 1 |
| 0 | Is Qualified In Steals | 0 |
| 25 | Total Bases | 38 |
| 46 | Plate Appearances | 44 |
| 324.0 | Projected Home Runs | 810.0 |
| 6 | Extra Base Hits | 9 |
| 9.3 | Runs Created | 14.5 |
| .349 | Batting Average | .439 |
| 1.000 | Pinch Hit Average | .000 |
| .581 | Slugging Percentage | .927 |
| .302 | Secondary Average | .537 |
| .391 | On Base Percentage | .477 |
| .973 | OBP Pct + SLG Pct | 1.404 |
| 0.8 | Ground To Fly Ball Ratio | 0.7 |
| 9.0 | Runs Created Per 27 Outs | 16.3 |
| 73.0 | Batter Rating | 93.5 |
| 21.5 | At Bats Per Home Run | 8.2 |
| 0.00 | Stolen Base Percentage | 0.00 |
| 3.43 | Pitches Per Plate Appearance | 4.00 |
| .233 | Isolated Power | .488 |
| 0.33 | Walk To Strikeout Ratio | 0.25 |
| .065 | Walks Per Plate Appearance | .045 |
| -.047 | Secondary Average Minus Batting Average | .098 |
| 22.0 | Runs Produced | 26.0 |
| 1.0 | Runs Ratio | 1.0 |
| 0.6 | Patience Ratio | 1.0 |
| 0.4 | Balls In Play Average | 0.5 |
| 112.5 | MLB Rating | 134.0 |
| 0.0 | Offensive Wins Above Replacement | 0.0 |
| 0.0 | Wins Above Replacement | 0.0 |
Game Information

Location: Chicago, Illinois
Attendance: 39,109 | Capacity:
2025 National League West Standings
| TEAM | W | L | PCT | GB | STRK |
|---|---|---|---|---|---|
 San Diego San Diego |
- | 6 | L2 | 0.71428573 | 15 |
 Los Angeles Los Angeles |
0.5 | 7 | L1 | 0.6818182 | 15 |
 San Francisco San Francisco |
1 | 7 | W1 | 0.6666667 | 14 |
 Arizona Arizona |
3 | 9 | L2 | 0.5714286 | 12 |
 Colorado Colorado |
11 | 16 | L7 | 0.15789473 | 3 |
2025 National League Central Standings
| TEAM | W | L | PCT | GB | STRK |
|---|---|---|---|---|---|
 Chicago Chicago |
- | 9 | W2 | 0.6086956 | 14 |
 Milwaukee Milwaukee |
2 | 10 | L1 | 0.52380955 | 11 |
 Cincinnati Cincinnati |
3 | 11 | L1 | 0.47619048 | 10 |
 St. Louis St. Louis |
4 | 12 | L3 | 0.42857143 | 9 |
 Pittsburgh Pittsburgh |
5.5 | 14 | L2 | 0.36363637 | 8 |