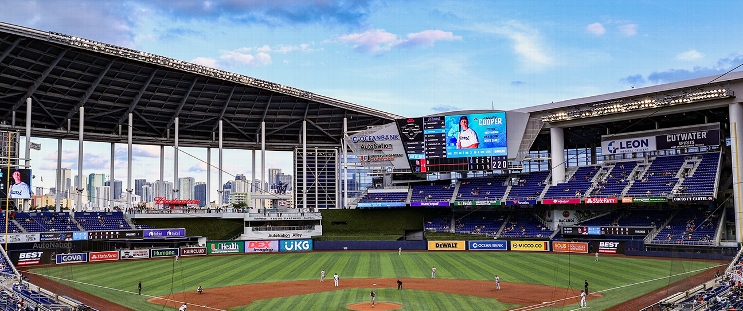
Arizona Diamondbacks at Miami Marlins
· Major League Baseball
6 - 2

Diamondbacks hit 4 homers to beat Marlins 6-2 for 4th straight win

Josh Naylor, Pavin Smith and Tim Tawa added solo shots for the Diamondbacks, who have won six of seven following a three-game skid. They'll go for a three-game sweep of the Marlins on Thursday afternoon.
Brandon Pfaadt (3-1) allowed one run and five hits over 5 2/3 innings, striking out six.
Corbin Carroll had a go-ahead RBI single in the fifth to stretch his on-base streak to a career-high 24 games dating to Sept. 23, 2024, tied for the longest active run in the majors.
Miami reliever Tyler Phillips gave up Gurriel's third homer of the season, a two-out drive to left field in the eighth that made it 6-1.
Otto Lopez doubled home a run for the Marlins in the eighth. Xavier Edwards and Jesús Sánchez each had two hits.
Matt Mervis hit his fourth homer off Pfaadt in the fourth.
Max Meyer (1-2) matched his career high with eight strikeouts. He gave up three runs and five hits in six innings.
Tawa connected in the seventh for his first major league homer.
How can I watch Arizona Diamondbacks vs. Miami Marlins?
- TV Channel: Diamondbacks at Marlins 2022 MLB Baseball, is broadcasted on MLB.TV.
- Online streaming: Sign up for Fubo.
Scoring Summary
 |
9th Inning | Edwards flied out to left. |
 |
9th Inning | Pauley flied out to left. |
 |
9th Inning | Hill grounded out to first. |
 |
9th Inning | Martinez relieved Puk |
 |
9th Inning | Grichuk as designated hitter. |
 |
9th Inning | Grichuk flied out to right. |
Statistics
 ARI ARI |
 MIA MIA |
|
|---|---|---|
| 1 | Games Played | 1 |
| 1 | Team Games Played | 1 |
| 0 | Hit By Pitch | 1 |
| 15 | Ground Balls | 10 |
| 9 | Strikeouts | 10 |
| 6 | Runs Batted In | 2 |
| 0 | Sacrifice Hit | 0 |
| 9 | Hits | 7 |
| 0 | Stolen Bases | 0 |
| 4 | Walks | 3 |
| 0 | Catcher Interference | 0 |
| 6 | Runs | 2 |
| 0 | Ground Into Double Play | 0 |
| 0 | Sacrifice Flies | 0 |
| 35 | At Bats | 33 |
| 4 | Home Runs | 1 |
| 0 | Grand Slam Home Runs | 0 |
| 10 | Runners Left On Base | 12 |
| 0 | Triples | 0 |
| 1 | Game Winning RBIs | 0 |
| 0 | Intentional Walks | 0 |
| 1 | Doubles | 1 |
| 11 | Fly Balls | 13 |
| 0 | Caught Stealing | 1 |
| 157 | Pitches | 135 |
| 0 | Games Started | 0 |
| 1 | Pinch At Bats | 3 |
| 0 | Pinch Hits | 1 |
| 0.0 | Player Rating | 0.0 |
| 1 | Is Qualified | 1 |
| 0 | Is Qualified In Steals | 1 |
| 22 | Total Bases | 11 |
| 39 | Plate Appearances | 37 |
| 648.0 | Projected Home Runs | 162.0 |
| 5 | Extra Base Hits | 2 |
| 7.3 | Runs Created | 3.1 |
| .257 | Batting Average | .212 |
| .000 | Pinch Hit Average | .333 |
| .629 | Slugging Percentage | .333 |
| .486 | Secondary Average | .182 |
| .333 | On Base Percentage | .297 |
| .962 | OBP Pct + SLG Pct | .631 |
| 1.4 | Ground To Fly Ball Ratio | 0.8 |
| 7.6 | Runs Created Per 27 Outs | 3.1 |
| 47.0 | Batter Rating | 20.0 |
| 8.8 | At Bats Per Home Run | 33.0 |
| 0.00 | Stolen Base Percentage | 0.00 |
| 4.03 | Pitches Per Plate Appearance | 3.65 |
| .371 | Isolated Power | .121 |
| 0.44 | Walk To Strikeout Ratio | 0.30 |
| .103 | Walks Per Plate Appearance | .081 |
| .229 | Secondary Average Minus Batting Average | -.030 |
| 12.0 | Runs Produced | 4.0 |
| 1.0 | Runs Ratio | 1.0 |
| 0.7 | Patience Ratio | 0.4 |
| 0.2 | Balls In Play Average | 0.3 |
| 94.3 | MLB Rating | 72.8 |
| 0.0 | Offensive Wins Above Replacement | 0.0 |
| 0.0 | Wins Above Replacement | 0.0 |
Game Information

Location: Miami, Florida
Attendance: 8,438 | Capacity:
2025 National League West Standings
| TEAM | W | L | PCT | GB | STRK |
|---|---|---|---|---|---|
 San Diego San Diego |
- | 6 | L2 | 0.71428573 | 15 |
 Los Angeles Los Angeles |
0.5 | 7 | L1 | 0.6818182 | 15 |
 San Francisco San Francisco |
1 | 7 | W1 | 0.6666667 | 14 |
 Arizona Arizona |
3 | 9 | L2 | 0.5714286 | 12 |
 Colorado Colorado |
11 | 16 | L7 | 0.15789473 | 3 |
2025 National League East Standings
| TEAM | W | L | PCT | GB | STRK |
|---|---|---|---|---|---|
 New York New York |
- | 7 | W3 | 0.6666667 | 14 |
 Philadelphia Philadelphia |
1 | 8 | W3 | 0.61904764 | 13 |
 Miami Miami |
5.5 | 12 | L5 | 0.4 | 8 |
 Washington Washington |
5.5 | 12 | W1 | 0.4 | 8 |
 Atlanta Atlanta |
6.5 | 13 | W2 | 0.35 | 7 |