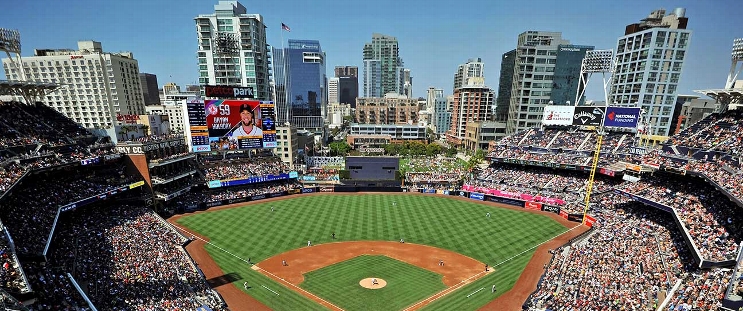
Chicago Cubs at San Diego Padres
· Major League Baseball
4 - 10

Tatis homers twice as Padres beat Cubs 10-4 to improve to 11-0 at home

The Padres have the best record in the majors at 14-3.
Tatis hit a solo homer with two outs in the third inning, scored the tiebreaking run on a wild pitch in a three-run seventh and then hit a two-run shot in the eighth. He has six home runs overall — tying seven other players for the big league lead — and five in his last six games. It was his 12th career multi-homer game.
Luis Arraez also homered in the eighth, his second, to give the Padres their first back-to-back homers this season.
The Cubs took a 3-1 lead in the fourth. Michael Busch hit a two-run homer off Dylan Cease, his fourth, after Justin Turner reached on a fielding error by third baseman Manny Machado. Nico Hoerner and Pete Crow-Armstrong hit consecutive doubles with one out.
Busch's homer ended a 37-inning scoreless streak by San Diego's pitching staff, dating to the third inning Wednesday at the Athletics. The Padres shut out the Colorado Rockies in a three-game weekend series.
The Padres tied it in the sixth and then went ahead in the seventh. Tatis drew a leadoff walk, advanced on Arraez's double and, after Machado was intentionally walked, raced home on a wild pitch by Nate Pearson (0-1) for a 4-3 lead. Gavin Sheets then hit a two-run single.
Adrian Morejon (1-0) got the win.
How can I watch Chicago Cubs vs. San Diego Padres?
- TV Channel: Cubs at Padres 2022 MLB Baseball, is broadcasted on MLB.TV.
- Online streaming: Sign up for Fubo.
Scoring Summary
 |
9th Inning | Swanson grounded out to third. |
 |
9th Inning | Busch walked. |
 |
9th Inning | Tucker to third on fielder's indifference. |
 |
9th Inning | Turner struck out swinging. |
 |
9th Inning | Tucker grounded into fielder's choice to second, Happ out at second. |
 |
9th Inning | Happ reached on infield single to pitcher. |
Statistics
 CHC CHC |
 SD SD |
|
|---|---|---|
| 1 | Games Played | 1 |
| 1 | Team Games Played | 1 |
| 0 | Hit By Pitch | 0 |
| 14 | Ground Balls | 13 |
| 9 | Strikeouts | 6 |
| 4 | Runs Batted In | 9 |
| 0 | Sacrifice Hit | 0 |
| 11 | Hits | 12 |
| 1 | Stolen Bases | 0 |
| 3 | Walks | 7 |
| 0 | Catcher Interference | 0 |
| 4 | Runs | 10 |
| 0 | Ground Into Double Play | 0 |
| 0 | Sacrifice Flies | 0 |
| 38 | At Bats | 36 |
| 1 | Home Runs | 3 |
| 0 | Grand Slam Home Runs | 0 |
| 19 | Runners Left On Base | 23 |
| 0 | Triples | 0 |
| 0 | Game Winning RBIs | 0 |
| 1 | Intentional Walks | 1 |
| 4 | Doubles | 1 |
| 15 | Fly Balls | 17 |
| 1 | Caught Stealing | 0 |
| 160 | Pitches | 174 |
| 0 | Games Started | 0 |
| 1 | Pinch At Bats | 1 |
| 0 | Pinch Hits | 0 |
| 0.0 | Player Rating | 0.0 |
| 1 | Is Qualified | 1 |
| 1 | Is Qualified In Steals | 0 |
| 18 | Total Bases | 22 |
| 41 | Plate Appearances | 43 |
| 162.0 | Projected Home Runs | 486.0 |
| 5 | Extra Base Hits | 4 |
| 6.0 | Runs Created | 9.5 |
| .289 | Batting Average | .333 |
| .000 | Pinch Hit Average | .000 |
| .474 | Slugging Percentage | .611 |
| .263 | Secondary Average | .472 |
| .341 | On Base Percentage | .442 |
| .815 | OBP Pct + SLG Pct | 1.053 |
| 0.9 | Ground To Fly Ball Ratio | 0.8 |
| 5.8 | Runs Created Per 27 Outs | 10.7 |
| 39.0 | Batter Rating | 61.0 |
| 38.0 | At Bats Per Home Run | 12.0 |
| 0.50 | Stolen Base Percentage | 0.00 |
| 3.90 | Pitches Per Plate Appearance | 4.05 |
| .184 | Isolated Power | .278 |
| 0.33 | Walk To Strikeout Ratio | 1.17 |
| .073 | Walks Per Plate Appearance | .163 |
| -.026 | Secondary Average Minus Batting Average | .139 |
| 8.0 | Runs Produced | 19.0 |
| 1.0 | Runs Ratio | 0.9 |
| 0.5 | Patience Ratio | 0.7 |
| 0.4 | Balls In Play Average | 0.3 |
| 87.8 | MLB Rating | 106.3 |
| 0.0 | Offensive Wins Above Replacement | 0.0 |
| 0.0 | Wins Above Replacement | 0.0 |
Game Information

Location: San Diego, California
Attendance: 47,078 | Capacity:
2025 National League Central Standings
| TEAM | W | L | PCT | GB | STRK |
|---|---|---|---|---|---|
 Chicago Chicago |
- | 9 | W2 | 0.6086956 | 14 |
 Milwaukee Milwaukee |
1.5 | 9 | W3 | 0.55 | 11 |
 Cincinnati Cincinnati |
2.5 | 10 | W1 | 0.5 | 10 |
 St. Louis St. Louis |
3.5 | 11 | L2 | 0.45 | 9 |
 Pittsburgh Pittsburgh |
5 | 13 | L1 | 0.3809524 | 8 |
2025 National League West Standings
| TEAM | W | L | PCT | GB | STRK |
|---|---|---|---|---|---|
 San Diego San Diego |
- | 5 | L1 | 0.75 | 15 |
 Los Angeles Los Angeles |
0.5 | 6 | W4 | 0.71428573 | 15 |
 San Francisco San Francisco |
2 | 7 | L2 | 0.65 | 13 |
 Arizona Arizona |
3.5 | 9 | L2 | 0.5714286 | 12 |
 Colorado Colorado |
11 | 15 | L6 | 0.16666667 | 3 |