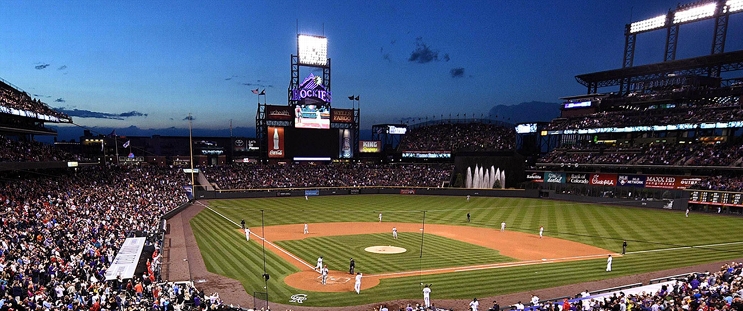
Milwaukee Brewers at Colorado Rockies
· Major League Baseball
7 - 1

Turang, Yelich, Contreras homer to lead Brewers over Rockies, 7-1

Freddy Peralta (1-1) struck out six in five solid innings for Milwaukee, which has won six of seven after starting the season with four straight losses.
The Brewers jumped ahead with a four-run third inning against Kyle Freeland (0-2) that included three straight RBI singles. Brenton Doyle hit a solo homer in the bottom of the inning for Colorado, which dropped to 2-8, 1/3 at home. That .200 winning percentage is tied with the 2005 and 2024 clubs for the worst start through 10 games in franchise history.
Turang chased Freeland with a one-out homer and after Churio grounded out Yelich and Contreras went back-to-back to make it a six-run lead.
The Brewers' win spoiled the major league debut of Colorado outfielder Zac Veen.
Veen was called up from Triple-A Albuquerque, hit seventh and started in right field. He flew out and struck out in his first two at-bats but then got his first hit on a bunt single in the sixth inning. He popped out in the ninth.
How can I watch Milwaukee Brewers vs. Colorado Rockies?
- TV Channel: Brewers at Rockies 2022 MLB Baseball, is broadcasted on MLB.TV.
- Online streaming: Sign up for Fubo.
Scoring Summary
 |
9th Inning | Bouchard struck out looking. |
 |
9th Inning | Bouchard hit for Moniak |
 |
9th Inning | Stallings struck out swinging. |
 |
9th Inning | Veen flied out to shortstop. |
 |
9th Inning | Hudson relieved Mears |
 |
9th Inning | Chourio grounded out to second. |
Statistics
 MIL MIL |
 COL COL |
|
|---|---|---|
| 1 | Games Played | 1 |
| 1 | Team Games Played | 1 |
| 1 | Hit By Pitch | 0 |
| 16 | Ground Balls | 8 |
| 7 | Strikeouts | 14 |
| 7 | Runs Batted In | 1 |
| 0 | Sacrifice Hit | 0 |
| 11 | Hits | 5 |
| 1 | Stolen Bases | 3 |
| 0 | Walks | 4 |
| 0 | Catcher Interference | 0 |
| 7 | Runs | 1 |
| 2 | Ground Into Double Play | 0 |
| 0 | Sacrifice Flies | 0 |
| 36 | At Bats | 32 |
| 3 | Home Runs | 1 |
| 0 | Grand Slam Home Runs | 0 |
| 10 | Runners Left On Base | 15 |
| 1 | Triples | 0 |
| 1 | Game Winning RBIs | 0 |
| 0 | Intentional Walks | 0 |
| 1 | Doubles | 1 |
| 13 | Fly Balls | 10 |
| 1 | Caught Stealing | 0 |
| 141 | Pitches | 138 |
| 0 | Games Started | 0 |
| 0 | Pinch At Bats | 1 |
| 0 | Pinch Hits | 0 |
| 0.0 | Player Rating | 0.0 |
| 1 | Is Qualified | 1 |
| 1 | Is Qualified In Steals | 1 |
| 23 | Total Bases | 9 |
| 37 | Plate Appearances | 36 |
| 486.0 | Projected Home Runs | 162.0 |
| 5 | Extra Base Hits | 2 |
| 6.3 | Runs Created | 2.8 |
| .306 | Batting Average | .156 |
| .000 | Pinch Hit Average | .000 |
| .639 | Slugging Percentage | .281 |
| .333 | Secondary Average | .344 |
| .324 | On Base Percentage | .250 |
| .963 | OBP Pct + SLG Pct | .531 |
| 1.2 | Ground To Fly Ball Ratio | 0.8 |
| 6.0 | Runs Created Per 27 Outs | 2.8 |
| 53.5 | Batter Rating | 17.0 |
| 12.0 | At Bats Per Home Run | 32.0 |
| 0.50 | Stolen Base Percentage | 1.00 |
| 3.81 | Pitches Per Plate Appearance | 3.83 |
| .333 | Isolated Power | .125 |
| 0.00 | Walk To Strikeout Ratio | 0.29 |
| .000 | Walks Per Plate Appearance | .111 |
| .028 | Secondary Average Minus Batting Average | .188 |
| 14.0 | Runs Produced | 2.0 |
| 1.0 | Runs Ratio | 1.0 |
| 0.7 | Patience Ratio | 0.4 |
| 0.3 | Balls In Play Average | 0.2 |
| 99.3 | MLB Rating | 66.5 |
| 0.0 | Offensive Wins Above Replacement | 0.0 |
| 0.0 | Wins Above Replacement | 0.0 |
Game Information

Location: Denver, Colorado
Attendance: 18,657 | Capacity:
2025 National League Central Standings
| TEAM | W | L | PCT | GB | STRK |
|---|---|---|---|---|---|
 Chicago Chicago |
- | 9 | L1 | 0.5714286 | 12 |
 Milwaukee Milwaukee |
1 | 9 | W2 | 0.5263158 | 10 |
 St. Louis St. Louis |
1.5 | 9 | W1 | 0.5 | 9 |
 Cincinnati Cincinnati |
1.5 | 9 | L1 | 0.5 | 9 |
 Pittsburgh Pittsburgh |
3.5 | 12 | W2 | 0.4 | 8 |
2025 National League West Standings
| TEAM | W | L | PCT | GB | STRK |
|---|---|---|---|---|---|
 San Diego San Diego |
- | 4 | W1 | 0.7894737 | 15 |
 San Francisco San Francisco |
1.5 | 5 | W1 | 0.7222222 | 13 |
 Los Angeles Los Angeles |
1.5 | 6 | W3 | 0.7 | 14 |
 Arizona Arizona |
3.5 | 7 | W4 | 0.6111111 | 11 |
 Colorado Colorado |
11.5 | 15 | L6 | 0.16666667 | 3 |