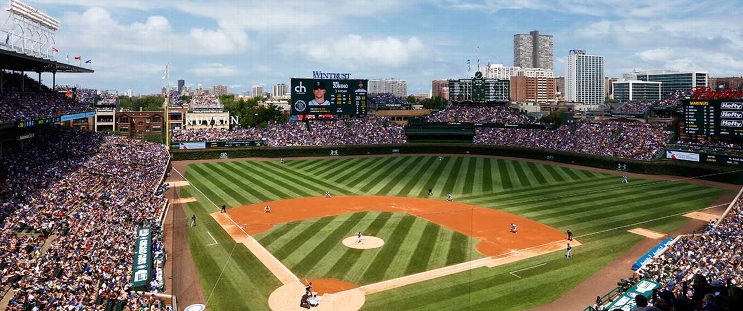
Texas Rangers at Chicago Cubs
· Major League Baseball
6 - 10

Swanson hits tiebreaking single in 4-run eighth as the Cubs beat the Rangers 10-6

The Cubs blew a 6-3 lead before taking advantage of two errors in the eighth and closing out their seventh win in eight games.
They had the bases loaded when Swanson singled to right against Chris Martin (0-1). Pete Crow-Armstrong added a two-run single against Hoby Milner on a 35-degree night.
Swanson homered leading off the second against Patrick Corbin. He also hit a sacrifice fly in a three-run fifth against Jacob Webb.
Seiya Suzuki and Pete Crow-Armstrong each had three hits and two RBI. Jameson Taillon pitched six innings of three-run ball, and Porter Hodge (1-0) got four outs for the win.
Wyatt Langford homered for Texas. Josh Jung had three hits after being sidelined since March 28 because of neck spasms. But the Rangers lost their second in a row after winning five straight.
Corbin went four innings in his Texas debut, allowing three runs and five hits. The 35-year-old left-hander signed with the Rangers three weeks ago.
How can I watch Texas Rangers vs. Chicago Cubs?
- TV Channel: Rangers at Cubs 2022 MLB Baseball, is broadcasted on MLB.TV.
- Online streaming: Sign up for Fubo.
Scoring Summary
 |
9th Inning | Pillar grounded out to second. |
 |
9th Inning | Seager singled to left. |
 |
9th Inning | Semien caught stealing second, catcher to shortstop. |
 |
9th Inning | Semien grounded into fielder's choice to shortstop, Taveras out at second. |
 |
9th Inning | Taveras reached on infield single to second. |
 |
9th Inning | Pressly relieved Hodge |
Statistics
 TEX TEX |
 CHC CHC |
|
|---|---|---|
| 1 | Games Played | 1 |
| 1 | Team Games Played | 1 |
| 0 | Hit By Pitch | 1 |
| 13 | Ground Balls | 8 |
| 10 | Strikeouts | 5 |
| 6 | Runs Batted In | 10 |
| 0 | Sacrifice Hit | 0 |
| 12 | Hits | 12 |
| 1 | Stolen Bases | 4 |
| 1 | Walks | 6 |
| 0 | Catcher Interference | 0 |
| 6 | Runs | 10 |
| 0 | Ground Into Double Play | 1 |
| 0 | Sacrifice Flies | 1 |
| 38 | At Bats | 35 |
| 1 | Home Runs | 1 |
| 0 | Grand Slam Home Runs | 0 |
| 12 | Runners Left On Base | 23 |
| 2 | Triples | 0 |
| 0 | Game Winning RBIs | 1 |
| 0 | Intentional Walks | 1 |
| 2 | Doubles | 1 |
| 15 | Fly Balls | 23 |
| 1 | Caught Stealing | 0 |
| 137 | Pitches | 156 |
| 0 | Games Started | 0 |
| 0 | Pinch At Bats | 0 |
| 0 | Pinch Hits | 0 |
| 0.0 | Player Rating | 0.0 |
| 1 | Is Qualified | 1 |
| 1 | Is Qualified In Steals | 1 |
| 21 | Total Bases | 16 |
| 39 | Plate Appearances | 43 |
| 162.0 | Projected Home Runs | 162.0 |
| 5 | Extra Base Hits | 2 |
| 6.6 | Runs Created | 8.2 |
| .316 | Batting Average | .343 |
| .000 | Pinch Hit Average | .000 |
| .553 | Slugging Percentage | .457 |
| .263 | Secondary Average | .400 |
| .333 | On Base Percentage | .442 |
| .886 | OBP Pct + SLG Pct | .899 |
| 0.9 | Ground To Fly Ball Ratio | 0.3 |
| 6.6 | Runs Created Per 27 Outs | 8.9 |
| 49.0 | Batter Rating | 61.0 |
| 38.0 | At Bats Per Home Run | 35.0 |
| 0.50 | Stolen Base Percentage | 1.00 |
| 3.51 | Pitches Per Plate Appearance | 3.63 |
| .237 | Isolated Power | .114 |
| 0.10 | Walk To Strikeout Ratio | 1.20 |
| .026 | Walks Per Plate Appearance | .140 |
| -.053 | Secondary Average Minus Batting Average | .057 |
| 12.0 | Runs Produced | 20.0 |
| 1.0 | Runs Ratio | 1.0 |
| 0.6 | Patience Ratio | 0.6 |
| 0.4 | Balls In Play Average | 0.4 |
| 95.3 | MLB Rating | 103.0 |
| 0.0 | Offensive Wins Above Replacement | 0.0 |
| 0.0 | Wins Above Replacement | 0.0 |
Game Information

Location: Chicago, Illinois
Attendance: 27,694 | Capacity:
2025 American League West Standings
| TEAM | W | L | PCT | GB | STRK |
|---|---|---|---|---|---|
 Texas Texas |
- | 7 | W2 | 0.6111111 | 11 |
 Los Angeles Los Angeles |
1.5 | 8 | L3 | 0.5294118 | 9 |
 Seattle Seattle |
2 | 9 | W1 | 0.5 | 9 |
 Houston Houston |
3 | 10 | L1 | 0.44444445 | 8 |
 Athletics Athletics |
3 | 10 | W2 | 0.44444445 | 8 |
2025 National League Central Standings
| TEAM | W | L | PCT | GB | STRK |
|---|---|---|---|---|---|
 Chicago Chicago |
- | 9 | L1 | 0.5714286 | 12 |
 Milwaukee Milwaukee |
1 | 9 | W2 | 0.5263158 | 10 |
 St. Louis St. Louis |
1.5 | 9 | W1 | 0.5 | 9 |
 Cincinnati Cincinnati |
1.5 | 9 | L1 | 0.5 | 9 |
 Pittsburgh Pittsburgh |
3.5 | 12 | W2 | 0.4 | 8 |