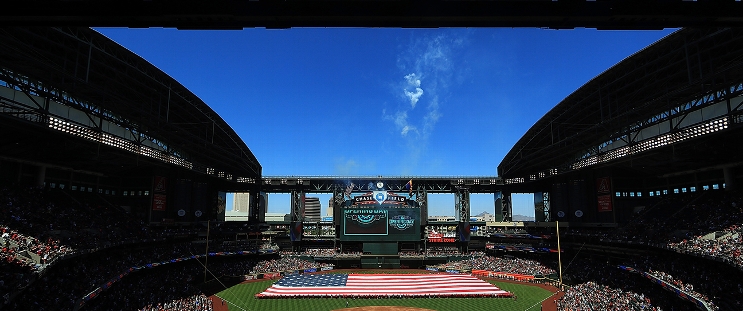
Baltimore Orioles at Arizona Diamondbacks
· Major League Baseball
5 - 1

Eflin throws 6 quality innings but leaves with shoulder fatigue as Orioles beat Diamondbacks 5-1

Ryan Mountcastle had a crucial two-run single with two outs in the fifth, hitting a low slider from Zac Gallen into center field for a 5-1 lead. That ended a tough outing for Gallen, who allowed five runs in 4 2/3 innings.
Gallen (1-2) — coming off a 13-strikeout performance against the New York Yankees last week — gave up seven hits, walked four and struck out two.
Ryan O'Hearn hit a solo shot in the first, driving Gallen's knuckle-curve over the right-field fence. Baltimore pushed its advantage to 2-0 in the third when Gunnar Henderson hit a leadoff double and scored on Adley Rutschman's single.
Henderson reached base three times, scored two runs and had two stolen bases. The Orioles have won two of three.
Eflin (2-1) threw 73 pitches, 47 for strikes. He allowed four hits and struck out one. Orioles manager Brandon Hyde said Eflin's velocity dropped some in the sixth inning and the right-hander would have tests done on his shoulder Tuesday.
Arizona scored in the fourth on Lourdes Gurriel Jr.'s sacrifice fly. Josh Naylor had two hits, including a double. The Diamondbacks have lost three straight.
Mountcastle followed with his two-run single that made it 5-1.
How can I watch Baltimore Orioles vs. Arizona Diamondbacks?
- TV Channel: Orioles at Diamondbacks 2022 MLB Baseball, is broadcasted on MLB.TV.
- Online streaming: Sign up for Fubo.
Scoring Summary
 |
9th Inning | Suárez popped out to shortstop. |
 |
9th Inning | Gurriel Jr. grounded out to shortstop. |
 |
9th Inning | Naylor grounded out to second. |
 |
9th Inning | Bautista relieved Soto |
 |
9th Inning | Rutschman grounded out to pitcher. |
 |
9th Inning | Henderson flied out to left. |
Statistics
 BAL BAL |
 ARI ARI |
|
|---|---|---|
| 1 | Games Played | 1 |
| 1 | Team Games Played | 1 |
| 0 | Hit By Pitch | 1 |
| 11 | Ground Balls | 14 |
| 6 | Strikeouts | 3 |
| 5 | Runs Batted In | 1 |
| 0 | Sacrifice Hit | 0 |
| 7 | Hits | 5 |
| 2 | Stolen Bases | 0 |
| 5 | Walks | 0 |
| 0 | Catcher Interference | 0 |
| 5 | Runs | 1 |
| 1 | Ground Into Double Play | 0 |
| 0 | Sacrifice Flies | 1 |
| 33 | At Bats | 31 |
| 1 | Home Runs | 0 |
| 0 | Grand Slam Home Runs | 0 |
| 13 | Runners Left On Base | 9 |
| 0 | Triples | 0 |
| 1 | Game Winning RBIs | 0 |
| 0 | Intentional Walks | 0 |
| 2 | Doubles | 2 |
| 16 | Fly Balls | 15 |
| 0 | Caught Stealing | 0 |
| 149 | Pitches | 111 |
| 0 | Games Started | 0 |
| 0 | Pinch At Bats | 1 |
| 0 | Pinch Hits | 0 |
| 0.0 | Player Rating | 0.0 |
| 1 | Is Qualified | 1 |
| 1 | Is Qualified In Steals | 0 |
| 12 | Total Bases | 7 |
| 38 | Plate Appearances | 33 |
| 162.0 | Projected Home Runs | 0.0 |
| 3 | Extra Base Hits | 2 |
| 4.2 | Runs Created | 0.9 |
| .212 | Batting Average | .161 |
| .000 | Pinch Hit Average | .000 |
| .364 | Slugging Percentage | .226 |
| .364 | Secondary Average | .065 |
| .316 | On Base Percentage | .182 |
| .679 | OBP Pct + SLG Pct | .408 |
| 0.7 | Ground To Fly Ball Ratio | 0.9 |
| 4.2 | Runs Created Per 27 Outs | 0.9 |
| 36.0 | Batter Rating | 13.0 |
| 33.0 | At Bats Per Home Run | 0.0 |
| 1.00 | Stolen Base Percentage | 0.00 |
| 3.92 | Pitches Per Plate Appearance | 3.36 |
| .152 | Isolated Power | .065 |
| 0.83 | Walk To Strikeout Ratio | 0.00 |
| .132 | Walks Per Plate Appearance | .000 |
| .152 | Secondary Average Minus Batting Average | -.097 |
| 10.0 | Runs Produced | 2.0 |
| 1.0 | Runs Ratio | 1.0 |
| 0.5 | Patience Ratio | 0.2 |
| 0.2 | Balls In Play Average | 0.2 |
| 81.8 | MLB Rating | 66.3 |
| 0.0 | Offensive Wins Above Replacement | 0.0 |
| 0.0 | Wins Above Replacement | 0.0 |
Game Information

Location: Phoenix, Arizona
Attendance: 20,333 | Capacity:
2025 American League East Standings
| TEAM | W | L | PCT | GB | STRK |
|---|---|---|---|---|---|
 New York New York |
- | 7 | W3 | 0.6111111 | 11 |
 Toronto Toronto |
0.5 | 8 | W2 | 0.57894737 | 11 |
 Boston Boston |
2 | 10 | W2 | 0.5 | 10 |
 Tampa Bay Tampa Bay |
3 | 10 | L2 | 0.44444445 | 8 |
 Baltimore Baltimore |
3.5 | 10 | W1 | 0.4117647 | 7 |
2025 National League West Standings
| TEAM | W | L | PCT | GB | STRK |
|---|---|---|---|---|---|
 San Diego San Diego |
- | 4 | W1 | 0.7894737 | 15 |
 San Francisco San Francisco |
1.5 | 5 | W1 | 0.7222222 | 13 |
 Los Angeles Los Angeles |
1.5 | 6 | W3 | 0.7 | 14 |
 Arizona Arizona |
3.5 | 7 | W4 | 0.6111111 | 11 |
 Colorado Colorado |
11.5 | 15 | L6 | 0.16666667 | 3 |