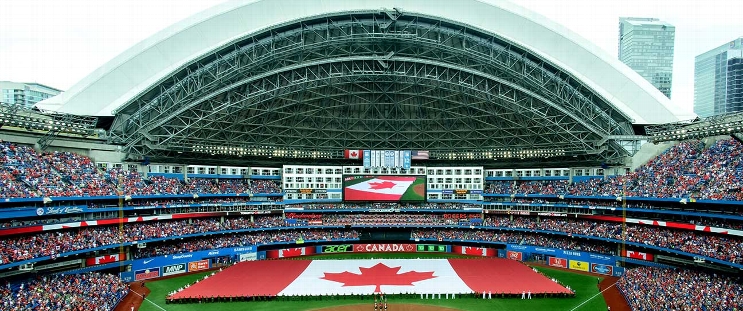
Washington Nationals at Toronto Blue Jays
· Major League Baseball
3 - 5

Bichette gets tiebreaking hit in eighth, Blue Jays beat Nationals 5-3 for 3rd straight win

The Blue Jays finished with 12 hits, all singles.
Bichette bounced an 0-2 pitch from Washington left-hander Jose A. Ferrer (0-1) down the first base line to drive in George Springer and Will Wagner.
Chad Green (1-0) got one out for the win and Jeff Hoffman finished with a 1-2-3 ninth for his second save in two opportunities.
Toronto’s José Berríos allowed two runs and four hits in 5 2/3 innings. He walked three and struck out eight.
Washington starter Trevor Williams allowed three runs and 10 hits in five innings. He walked none and struck out three.
Springer, Ernie Clement and Alan Roden all hit RBI singles in Toronto’s three-run second.
Nationals catcher Keibert Ruiz hit a two-run single off Berríos in the sixth and CJ Abrams tied it with an RBI double off left-hander Mason Fluharty, making his major league debut, in the seventh.
Abrams went 3 for 4 with two doubles and scored a run.
How can I watch Washington Nationals vs. Toronto Blue Jays?
- TV Channel: Nationals at Blue Jays 2022 MLB Baseball, is broadcasted on MLB.TV.
- Online streaming: Sign up for Fubo.
Scoring Summary
 |
9th Inning | Call popped out to first. |
 |
9th Inning | DeJong struck out swinging. |
 |
9th Inning | García Jr. lined out to right. |
 |
9th Inning | Hoffman relieved Green |
 |
9th Inning | Straw in center field. |
 |
9th Inning | Springer in right field. |
Statistics
 WSH WSH |
 TOR TOR |
|
|---|---|---|
| 1 | Games Played | 1 |
| 1 | Team Games Played | 1 |
| 0 | Hit By Pitch | 1 |
| 9 | Ground Balls | 17 |
| 12 | Strikeouts | 7 |
| 3 | Runs Batted In | 5 |
| 0 | Sacrifice Hit | 2 |
| 6 | Hits | 12 |
| 1 | Stolen Bases | 0 |
| 4 | Walks | 2 |
| 0 | Catcher Interference | 0 |
| 3 | Runs | 5 |
| 1 | Ground Into Double Play | 2 |
| 0 | Sacrifice Flies | 0 |
| 31 | At Bats | 33 |
| 0 | Home Runs | 0 |
| 0 | Grand Slam Home Runs | 0 |
| 12 | Runners Left On Base | 22 |
| 0 | Triples | 0 |
| 0 | Game Winning RBIs | 1 |
| 0 | Intentional Walks | 0 |
| 3 | Doubles | 0 |
| 10 | Fly Balls | 11 |
| 0 | Caught Stealing | 0 |
| 137 | Pitches | 140 |
| 0 | Games Started | 0 |
| 0 | Pinch At Bats | 1 |
| 0 | Pinch Hits | 0 |
| 0.0 | Player Rating | 0.0 |
| 1 | Is Qualified | 1 |
| 1 | Is Qualified In Steals | 0 |
| 9 | Total Bases | 12 |
| 35 | Plate Appearances | 38 |
| 0.0 | Projected Home Runs | 0.0 |
| 3 | Extra Base Hits | 0 |
| 2.5 | Runs Created | 4.7 |
| .194 | Batting Average | .364 |
| .000 | Pinch Hit Average | .000 |
| .290 | Slugging Percentage | .364 |
| .258 | Secondary Average | .061 |
| .286 | On Base Percentage | .417 |
| .576 | OBP Pct + SLG Pct | .780 |
| 0.9 | Ground To Fly Ball Ratio | 1.5 |
| 2.6 | Runs Created Per 27 Outs | 5.1 |
| 25.0 | Batter Rating | 32.0 |
| 0.0 | At Bats Per Home Run | 0.0 |
| 1.00 | Stolen Base Percentage | 0.00 |
| 3.91 | Pitches Per Plate Appearance | 3.68 |
| .097 | Isolated Power | .000 |
| 0.33 | Walk To Strikeout Ratio | 0.29 |
| .114 | Walks Per Plate Appearance | .053 |
| .065 | Secondary Average Minus Batting Average | -.303 |
| 6.0 | Runs Produced | 10.0 |
| 1.0 | Runs Ratio | 1.0 |
| 0.4 | Patience Ratio | 0.4 |
| 0.3 | Balls In Play Average | 0.5 |
| 72.0 | MLB Rating | 87.3 |
| 0.0 | Offensive Wins Above Replacement | 0.0 |
| 0.0 | Wins Above Replacement | 0.0 |
Game Information

Location: Toronto, Ontario
Attendance: 21,845 | Capacity:
2025 National League East Standings
| TEAM | W | L | PCT | GB | STRK |
|---|---|---|---|---|---|
 Philadelphia Philadelphia |
- | 1 | W2 | 0.8 | 4 |
 Miami Miami |
1 | 3 | L1 | 0.5714286 | 4 |
 New York New York |
1.5 | 3 | W1 | 0.5 | 3 |
 Washington Washington |
3.5 | 5 | L3 | 0.16666667 | 1 |
 Atlanta Atlanta |
5 | 7 | L7 | 0 | 0 |
2025 American League East Standings
| TEAM | W | L | PCT | GB | STRK |
|---|---|---|---|---|---|
 Toronto Toronto |
- | 2 | W4 | 0.71428573 | 5 |
 Tampa Bay Tampa Bay |
0.5 | 2 | L1 | 0.6666667 | 4 |
 New York New York |
1 | 2 | L2 | 0.6 | 3 |
 Baltimore Baltimore |
1.5 | 3 | L1 | 0.5 | 3 |
 Boston Boston |
2.5 | 4 | W1 | 0.33333334 | 2 |