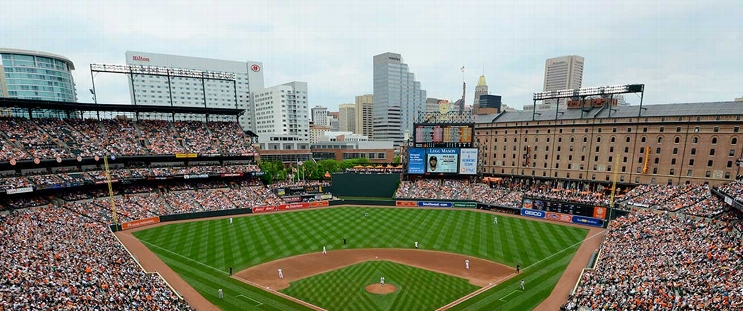
Boston Red Sox at Baltimore Orioles
· Major League Baseball
5 - 8

Orioles score 4 in both the 1st and the 8th, top the Red Sox 8-5 in Baltimore's home opener

Baltimore scored four runs in the first and four more in the eighth in its home opener, and the Orioles' bullpen threw 4 2/3 innings. Matt Bowman, Seranthony Domínguez (1-0), Keegan Akin and Yennier Cano blanked Boston in relief. Then Félix Bautista came on for the ninth to a big ovation — the big closer missed all of last season because of Tommy John surgery.
Bautista allowed two runs and had to face Alex Bregman as the tying run with two on. Bregman hit a game-ending popup.
Orioles starter Cade Povich allowed three runs in 4 1/3 innings but struck out eight. Sean Newcomb (0-1) threw three shutout innings after allowing four runs in the first in his Boston debut.
Baltimore began the bottom of the first with four straight singles, including RBI hits by O'Neill and Ryan Mountcastle. Cedric Mullins added a two-out, two-run double to make it 4-0.
O'Neill, who signed with the Orioles in the offseason, had three singles and a double.
Jarren Duran hit a two-run triple in the second for Boston, and the Red Sox scored again in the third, but the Orioles pulled away in the eighth. Heston Kjerstad singled home a run, Mullins drove in two more with a bases-loaded single, and Jackson Holliday hit an RBI single.
How can I watch Boston Red Sox vs. Baltimore Orioles?
- TV Channel: Red Sox at Orioles 2022 MLB Baseball, is broadcasted on MASN.
- Online streaming: Sign up for Fubo.
Scoring Summary
 |
9th Inning | Bregman popped out to third. |
 |
9th Inning | Devers walked. |
 |
9th Inning | Duran to second on fielder's indifference. |
 |
9th Inning | Duran singled to left, González scored. |
 |
9th Inning | Casas grounded out to first, González to third. |
 |
9th Inning | Casas hit for Rafaela |
Statistics
 BOS BOS |
 BAL BAL |
|
|---|---|---|
| 1 | Games Played | 1 |
| 1 | Team Games Played | 1 |
| 0 | Hit By Pitch | 0 |
| 0 | Ground Balls | 0 |
| 13 | Strikeouts | 7 |
| 5 | Runs Batted In | 8 |
| 0 | Sacrifice Hit | 0 |
| 8 | Hits | 15 |
| 1 | Stolen Bases | 1 |
| 4 | Walks | 3 |
| 0 | Catcher Interference | 0 |
| 5 | Runs | 8 |
| 0 | Ground Into Double Play | 3 |
| 0 | Sacrifice Flies | 0 |
| 35 | At Bats | 35 |
| 0 | Home Runs | 0 |
| 0 | Grand Slam Home Runs | 0 |
| 16 | Runners Left On Base | 21 |
| 1 | Triples | 0 |
| 0 | Game Winning RBIs | 0 |
| 0 | Intentional Walks | 0 |
| 1 | Doubles | 2 |
| 0 | Fly Balls | 0 |
| 0 | Caught Stealing | 1 |
| 167 | Pitches | 121 |
| 0 | Games Started | 0 |
| 0 | Pinch At Bats | 0 |
| 0 | Pinch Hits | 0 |
| 0.0 | Player Rating | 0.0 |
| 1 | Is Qualified | 1 |
| 1 | Is Qualified In Steals | 1 |
| 11 | Total Bases | 17 |
| 39 | Plate Appearances | 38 |
| 0.0 | Projected Home Runs | 0.0 |
| 2 | Extra Base Hits | 2 |
| 3.8 | Runs Created | 6.5 |
| .229 | Batting Average | .429 |
| .000 | Pinch Hit Average | .000 |
| .314 | Slugging Percentage | .486 |
| .229 | Secondary Average | .143 |
| .308 | On Base Percentage | .474 |
| .622 | OBP Pct + SLG Pct | .959 |
| 0.0 | Ground To Fly Ball Ratio | 0.0 |
| 3.8 | Runs Created Per 27 Outs | 7.3 |
| 33.5 | Batter Rating | 52.0 |
| 0.0 | At Bats Per Home Run | 0.0 |
| 1.00 | Stolen Base Percentage | 0.50 |
| 4.28 | Pitches Per Plate Appearance | 3.18 |
| .086 | Isolated Power | .057 |
| 0.31 | Walk To Strikeout Ratio | 0.43 |
| .103 | Walks Per Plate Appearance | .079 |
| .000 | Secondary Average Minus Batting Average | -.286 |
| 10.0 | Runs Produced | 16.0 |
| 1.0 | Runs Ratio | 1.0 |
| 0.4 | Patience Ratio | 0.5 |
| 0.4 | Balls In Play Average | 0.5 |
| 79.3 | MLB Rating | 101.0 |
| 0.0 | Offensive Wins Above Replacement | 0.0 |
| 0.0 | Wins Above Replacement | 0.0 |
Game Information

Location: Baltimore, Maryland
Attendance: 45,002 | Capacity:
2025 American League East Standings
| TEAM | W | L | PCT | GB | STRK |
|---|---|---|---|---|---|
 New York New York |
- | 0 | W3 | 1 | 3 |
 Tampa Bay Tampa Bay |
0.5 | 1 | W2 | 0.75 | 3 |
 Baltimore Baltimore |
1 | 2 | W1 | 0.6 | 3 |
 Toronto Toronto |
1 | 2 | W2 | 0.6 | 3 |
 Boston Boston |
3 | 4 | L4 | 0.2 | 1 |