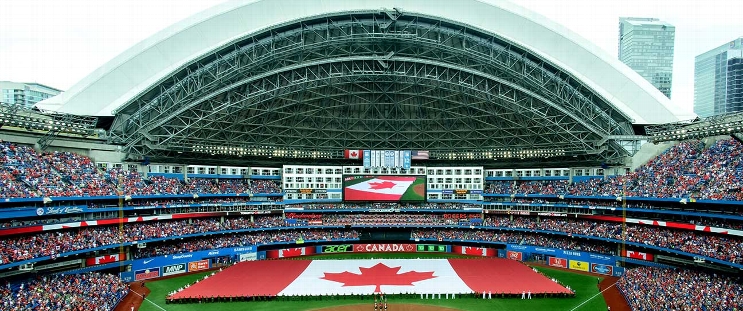
Baltimore Orioles at Toronto Blue Jays
· Major League Baseball
2 - 8

Guerrero and Gausman help the Blue Jays beat the Orioles 8-2

Bo Bichette had two hits, scored a run and drove in a run as Toronto bounced back from a 12-2 loss on Thursday on opening day. Kevin Gausman (1-0) pitched six innings of two-run ball.
Jackson Holliday hit a solo homer for Baltimore, but his one-out drive in the third inning was the Orioles' only extra-base hit.
The Orioles hit a franchise-record six opening-day homers on Thursday. They finished with three total hits Friday.
Blue Jays left-hander Brendon Little exited after striking out a pair of batters in the eighth because of a left lat cramp. Nick Sandlin finished for Toronto.
Right-hander Charlie Morton (0-1) lost his debut start with Baltimore, allowing four runs and seven hits in 3 1/3 innings.
At 41 years and 136 days, Morton became the oldest starting pitcher in franchise history. He surpassed Orlando Peña, who was 39 years and 177 days in a May 13, 1973, start against the Yankees.
Baltimore’s oldest pitcher was left-handed reliever Jesse Orosco, who was 42 years and 160 days old in a September 1999 game against the Yankees.
This version corrects the final score to 8-2 instead of 5-2.
How can I watch Baltimore Orioles vs. Toronto Blue Jays?
- TV Channel: Orioles at Blue Jays 2022 MLB Baseball, is broadcasted on Apple TV+.
- Online streaming: Sign up for Fubo.
Scoring Summary
 |
9th Inning | Mountcastle struck out swinging. |
 |
9th Inning | Mullins walked. |
 |
9th Inning | O'Hearn to second on passed ball by Kirk, Westburg to third on passed ball by Kirk. |
 |
9th Inning | O'Neill popped out to second. |
 |
9th Inning | O'Hearn walked. |
 |
9th Inning | Mullins to third on passed ball by Kirk. |
Statistics
 BAL BAL |
 TOR TOR |
|
|---|---|---|
| 1 | Games Played | 1 |
| 1 | Team Games Played | 1 |
| 0 | Hit By Pitch | 1 |
| 8 | Ground Balls | 11 |
| 9 | Strikeouts | 9 |
| 2 | Runs Batted In | 6 |
| 0 | Sacrifice Hit | 0 |
| 3 | Hits | 14 |
| 0 | Stolen Bases | 1 |
| 4 | Walks | 3 |
| 0 | Catcher Interference | 0 |
| 2 | Runs | 8 |
| 0 | Ground Into Double Play | 0 |
| 1 | Sacrifice Flies | 2 |
| 29 | At Bats | 34 |
| 1 | Home Runs | 0 |
| 0 | Grand Slam Home Runs | 0 |
| 10 | Runners Left On Base | 21 |
| 0 | Triples | 0 |
| 0 | Game Winning RBIs | 0 |
| 0 | Intentional Walks | 0 |
| 0 | Doubles | 3 |
| 13 | Fly Balls | 16 |
| 0 | Caught Stealing | 1 |
| 145 | Pitches | 167 |
| 0 | Games Started | 0 |
| 0 | Pinch At Bats | 1 |
| 0 | Pinch Hits | 1 |
| 0.0 | Player Rating | 0.0 |
| 1 | Is Qualified | 1 |
| 0 | Is Qualified In Steals | 1 |
| 6 | Total Bases | 17 |
| 34 | Plate Appearances | 40 |
| 162.0 | Projected Home Runs | 0.0 |
| 1 | Extra Base Hits | 3 |
| 1.0 | Runs Created | 7.8 |
| .103 | Batting Average | .412 |
| .000 | Pinch Hit Average | 1.000 |
| .207 | Slugging Percentage | .500 |
| .241 | Secondary Average | .176 |
| .206 | On Base Percentage | .450 |
| .413 | OBP Pct + SLG Pct | .950 |
| 0.6 | Ground To Fly Ball Ratio | 0.7 |
| 1.0 | Runs Created Per 27 Outs | 9.1 |
| 14.0 | Batter Rating | 49.0 |
| 29.0 | At Bats Per Home Run | 0.0 |
| 0.00 | Stolen Base Percentage | 0.50 |
| 4.26 | Pitches Per Plate Appearance | 4.18 |
| .103 | Isolated Power | .088 |
| 0.44 | Walk To Strikeout Ratio | 0.33 |
| .118 | Walks Per Plate Appearance | .075 |
| .138 | Secondary Average Minus Batting Average | -.235 |
| 4.0 | Runs Produced | 14.0 |
| 1.0 | Runs Ratio | 0.8 |
| 0.3 | Patience Ratio | 0.5 |
| 0.1 | Balls In Play Average | 0.6 |
| 64.5 | MLB Rating | 98.3 |
| 0.0 | Offensive Wins Above Replacement | 0.0 |
| 0.0 | Wins Above Replacement | 0.0 |
Game Information

Location: Toronto, Ontario
Attendance: 26,289 | Capacity:
2025 American League East Standings
| TEAM | W | L | PCT | GB | STRK |
|---|---|---|---|---|---|
 Toronto Toronto |
- | 2 | W4 | 0.71428573 | 5 |
 Tampa Bay Tampa Bay |
0.5 | 2 | L1 | 0.6666667 | 4 |
 New York New York |
0.5 | 2 | W1 | 0.6666667 | 4 |
 Boston Boston |
2 | 4 | W2 | 0.42857143 | 3 |
 Baltimore Baltimore |
2 | 4 | L2 | 0.42857143 | 3 |